
Understanding Your Blog's Analytics
A comprehensive guide to navigating and interpreting your blog's analytics data
Tracking Analytics Data
To track analytics data, the platform provides an endpoint (`POST /analytics/track`) that records various metrics about page views. When a page view is tracked, the following data can be recorded: `article_id`, `session_id`, `referrer`, `utm_source`, `utm_medium`, `utm_campaign`, `duration_seconds`, `scroll_depth_pct`, `device_type`, and `country_code`. The IP address of the viewer is hashed and stored for privacy. If a `referrer` is provided, the domain is extracted and stored. The `country_code` is determined by prioritizing CDN headers (Cloudflare, Vercel, AWS) and falls back to the request body if necessary. Note that certain country codes like 'XX' or '--' are filtered out as unknown.
- Ensure that your tracking requests include as much detail as possible for more comprehensive analytics.
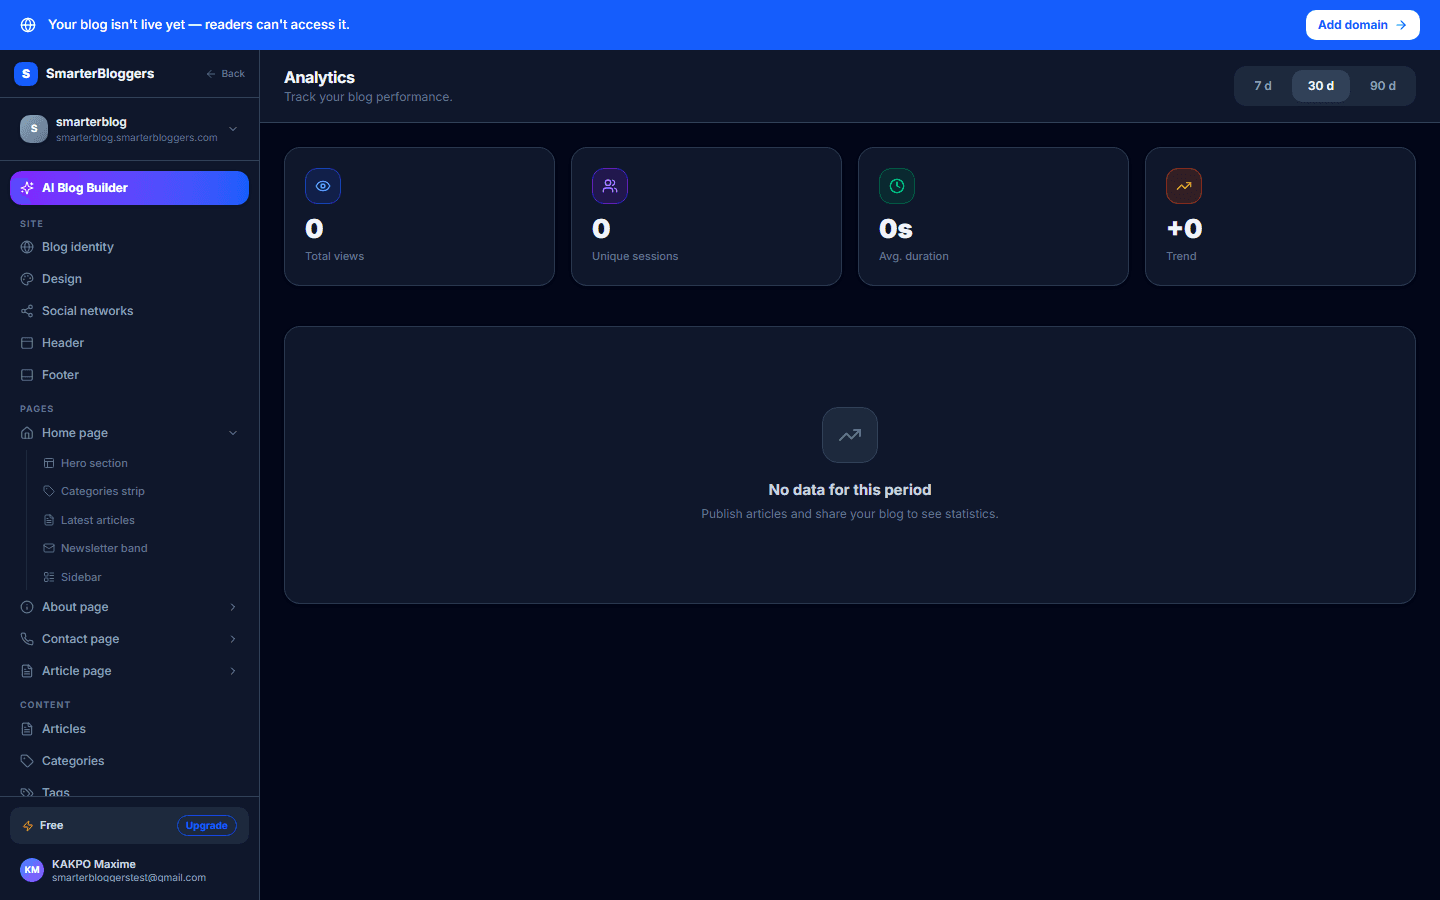
Overview of Analytics
The `GET /analytics/overview` endpoint provides a summary of your blog's performance over a specified period (default is 30 days, adjustable between 1 and 365 days). This overview includes:
- Total Views: The total number of page views recorded.
- Unique Sessions: The number of distinct sessions.
- Average Duration: The average time spent on pages.
- Bounce Rate: The percentage of sessions with only one page view.
- Views by Day: A daily breakdown of views.
- Top Articles: The most viewed articles, up to 10.
- Top Referrers: The top 10 domains referring traffic.
- Devices: A breakdown of views by device type.
- Countries: The top 15 countries by view count.
- Use the period selector to adjust the date range for your analytics overview.
Article-Specific Analytics
For detailed analytics on a specific article, use the `GET /analytics/articles/{article_id}` endpoint. This provides:
- Total Views: The total number of views for the article.
- Total Sessions: The number of unique sessions viewing the article.
- Daily Breakdown: Views, sessions, average duration, and average scroll depth by day.
- Focus on articles with high bounce rates to improve engagement.
Exporting Analytics Data
You can export your analytics data using the `GET /analytics/export` endpoint. The data can be exported in CSV format for a specified period (default is 30 days, adjustable between 1 and 365 days). The exported data includes:
- Date: The date of the recorded data.
- Article Title and Slug: Information about the article.
- Views and Sessions: Counts of views and unique sessions.
- Average Duration and Scroll: Average time spent and scroll depth.
- Device Type and Country: Breakdown by device and country.
- Use the exported data for deeper analysis in spreadsheet software.
What's next?
Now that you understand your blog's analytics, explore ways to improve engagement and reach. Consider using insights from top articles and referrers to guide content strategy.